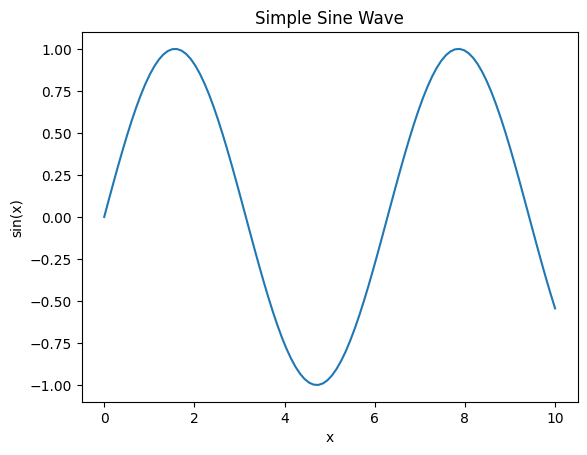
Matplotlib# matplotlib是一个流行的python绘图库。 A Simple Plot# import matplotlib.pyplot as plt import numpy as np x = np.linspace(0, 10, 100) y = np.sin(x) plt.plot(x, y) plt.title("Simple Sine Wave") plt.xlabel("x") plt.ylabel("sin(x)") plt.show()